
Fact: you need content tracking.
Let's face it; nobody gets content marketing right the first time.
…or the second time, or the third time, and so forth.
Sure, you can model your content marketing initiatives around "proven" strategies that countless guides, tutorials, and courses have mentioned. You could even spy on your competitor's strategy and borrow some ideas.
Unfortunately, what works for someone isn't guaranteed to work for everyone else.
There's no such thing as a one-size-fits-all strategy in content marketing.
If you want actual, sustainable results from your content marketing, you need to add content tracking to the equation.
What is content tracking?
"Alright, I'm sold — tell me more about this content tracking."
I'm glad you said that.
To put it simply, content tracking is all about monitoring and analysing the performance of content.
By performance, I mean their effectiveness in accomplishing marketing objectives, like:
- Generating web traffic
- Generating leads
- Getting clicks
- Maximising session duration
- Converting readers into subscribers or customers
For content tracking to work, you need to publish a handful of articles first.
Let's say your website has 20 pieces of content.
Content tracking lets you determine which of those 20 are winners and which are losers. Based on your findings, you can double down on strategies that worked well — then fix or get rid of the rest.
Keep going until you develop the perfect content strategy that's guaranteed to work.
TL;DR: Content tracking lets you get the performance that content is supposed to achieve.
How to create a content tracker
Now that you know how content tracking works let's set up your first content tracker.
When I think of content tracking and marketing performance measurement, one platform immediately comes to mind: Google Analytics.
What is Google Analytics?
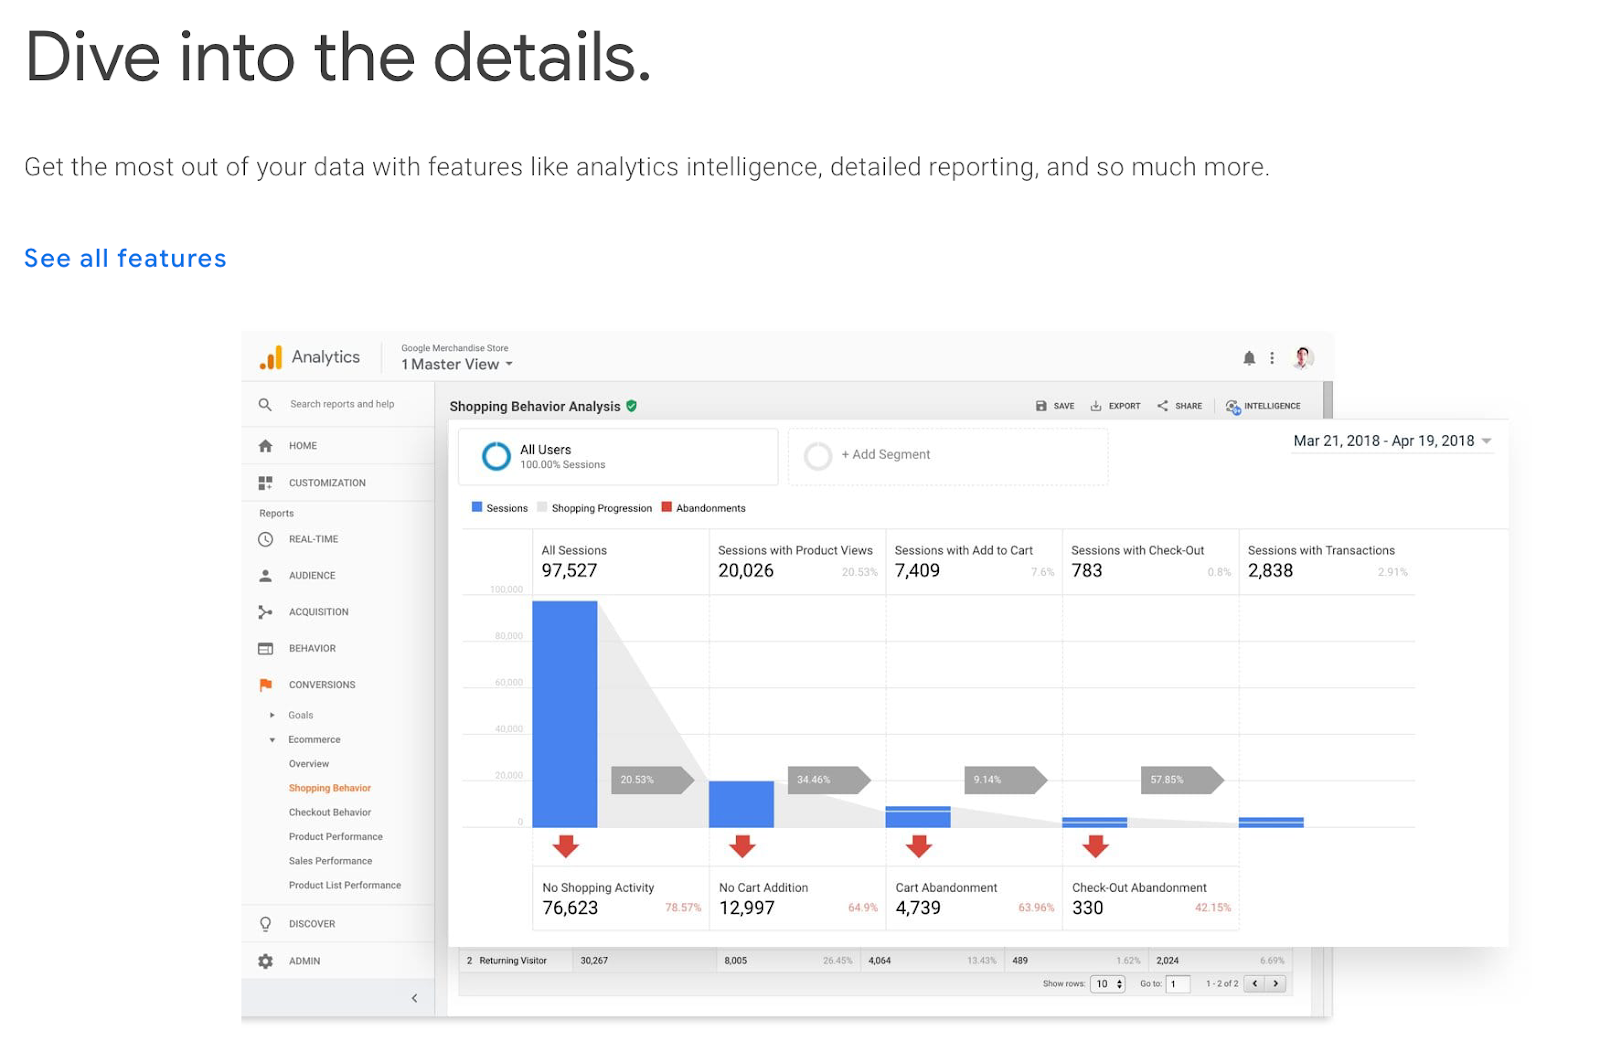
If you run any kind of website, Google Analytics is a must-have. It will give you an in-depth look at your audience's demographics, traffic sources, eCommerce performance, and many more.
Of course, it will also help you track the performance of your content and assess how users respond to them.
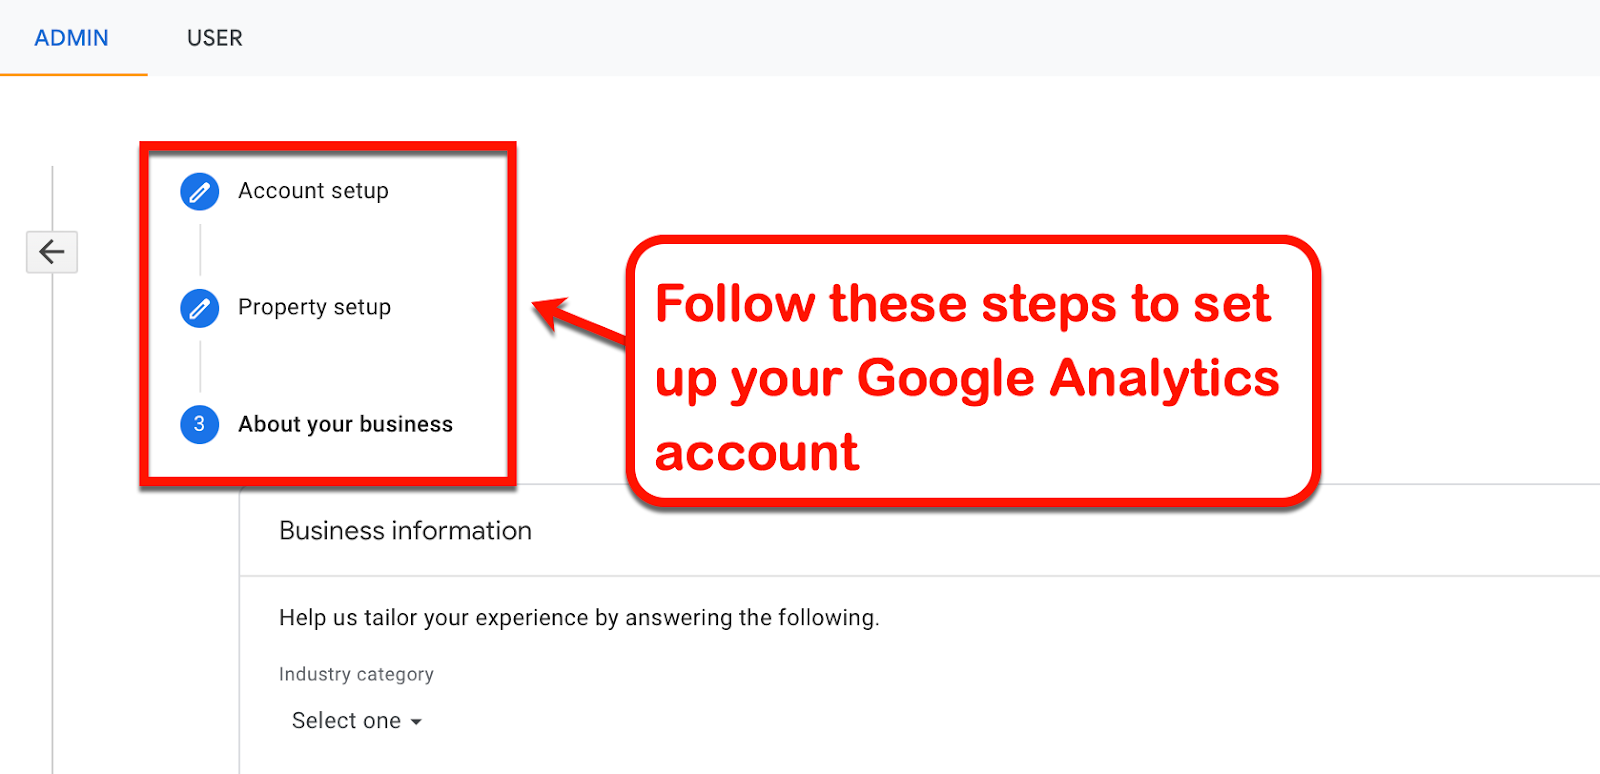
To get started with Google Analytics, the first step is to set up a new account you'll associate with your website. This process is broken down into three phases:
- Naming your Google Analytics account
- Naming your property (website or app)
- Entering basic information about your business
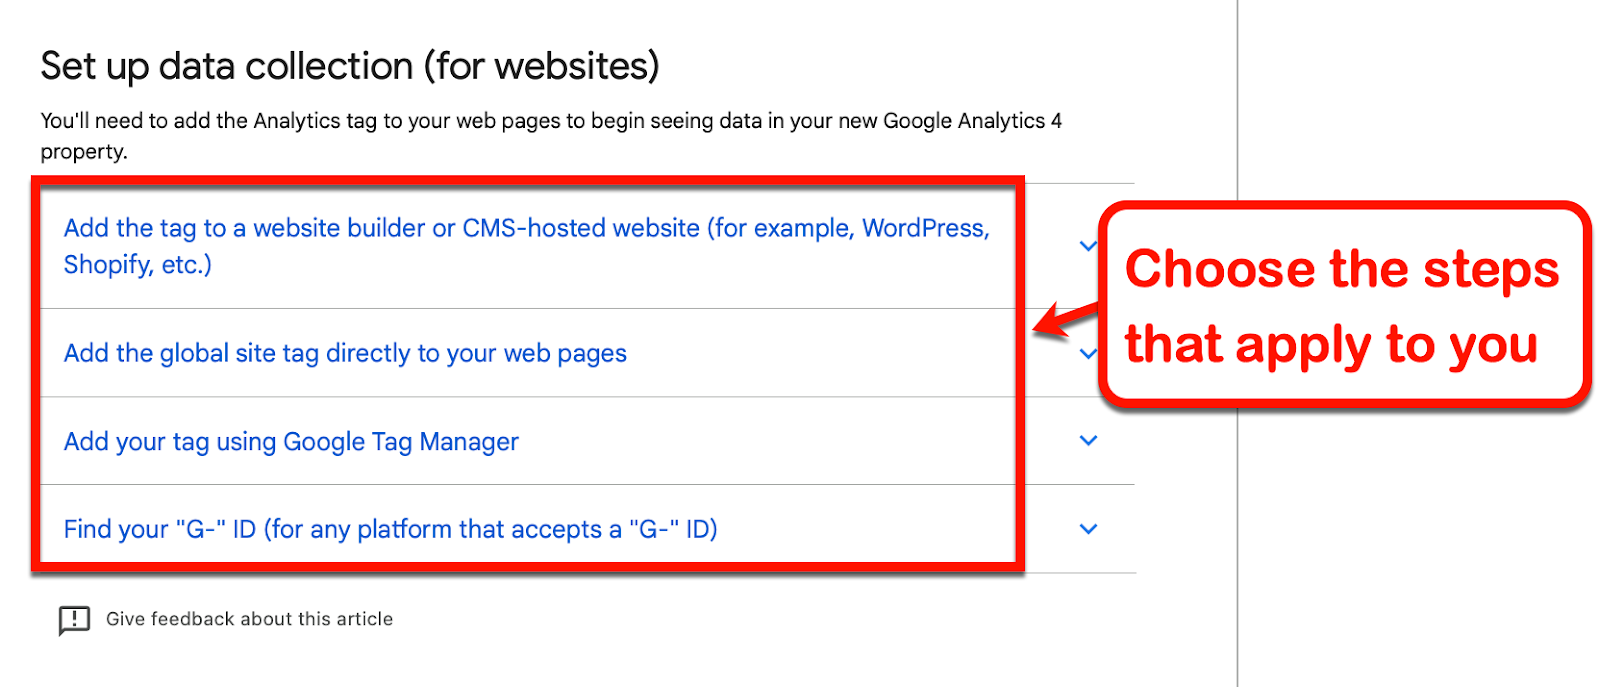
Once your Google Analytics account is prepared, you need to connect your website manually. Doing so allows the analytics platform to pull data from your property.
For the complete instructions, check out the official guide from Google. Take note that the steps will differ based on how your hosting and website platform works.
If you're using WordPress (something you should consider), you can use the GA Google Analytics plugin to speed things up.
I recommend getting the plugin from your WordPress dashboard to simplify the installation and activation process.

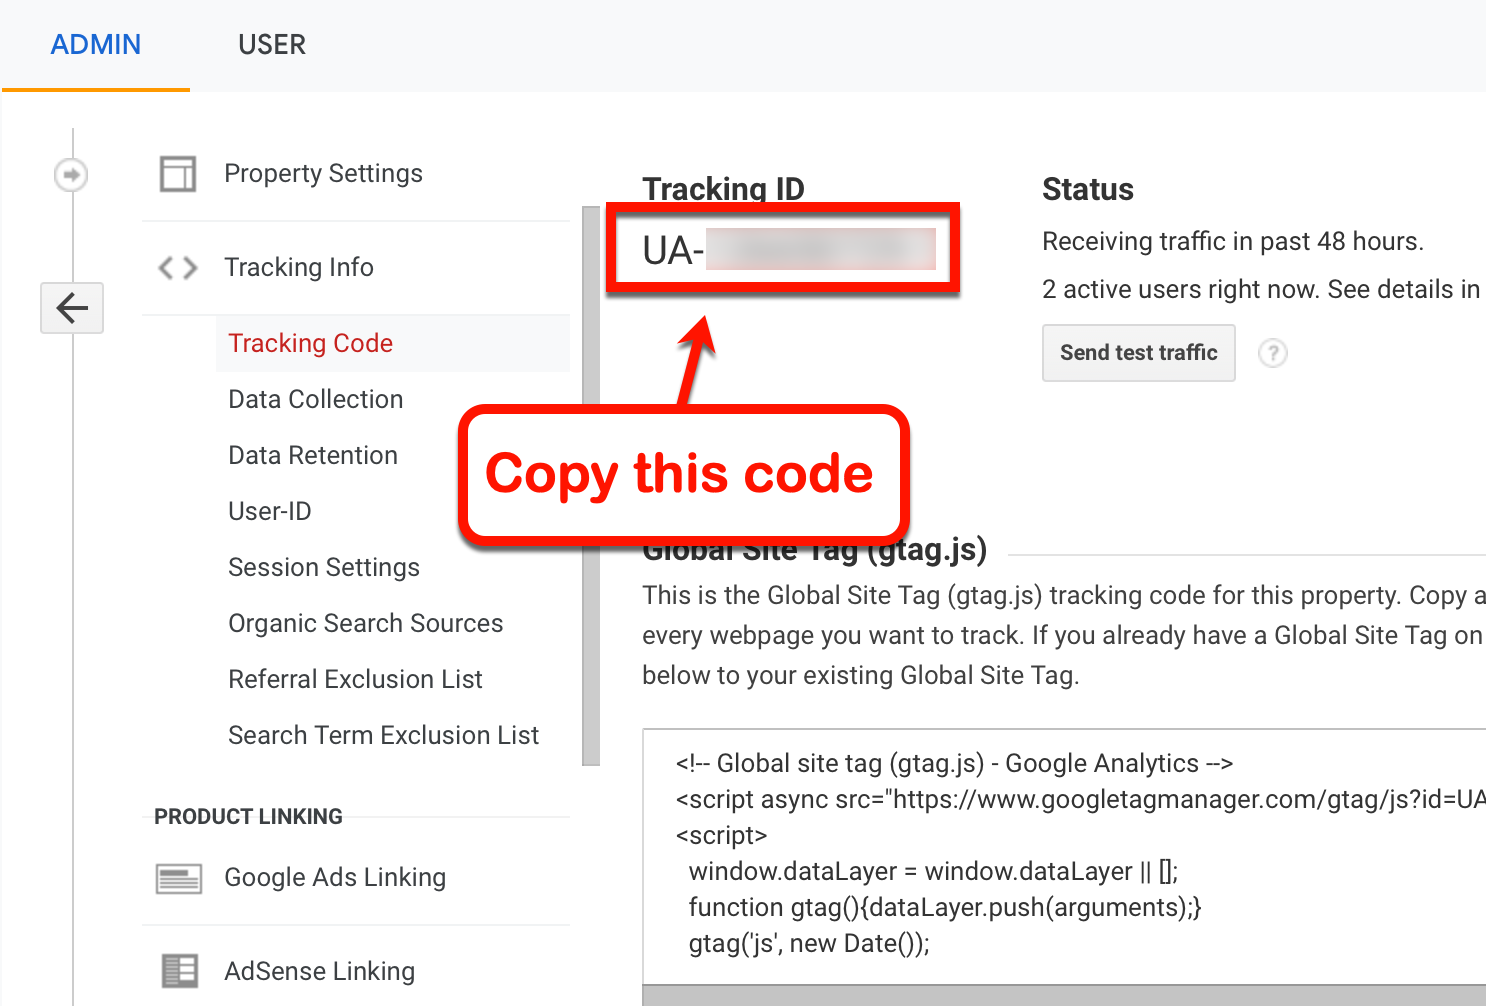
After installing the plugin, head to your Google Analytics dashboard and find your tracking code.
Just go to 'Admin,' select 'Tracking Info' under the property column, and click 'Tracking Code.'
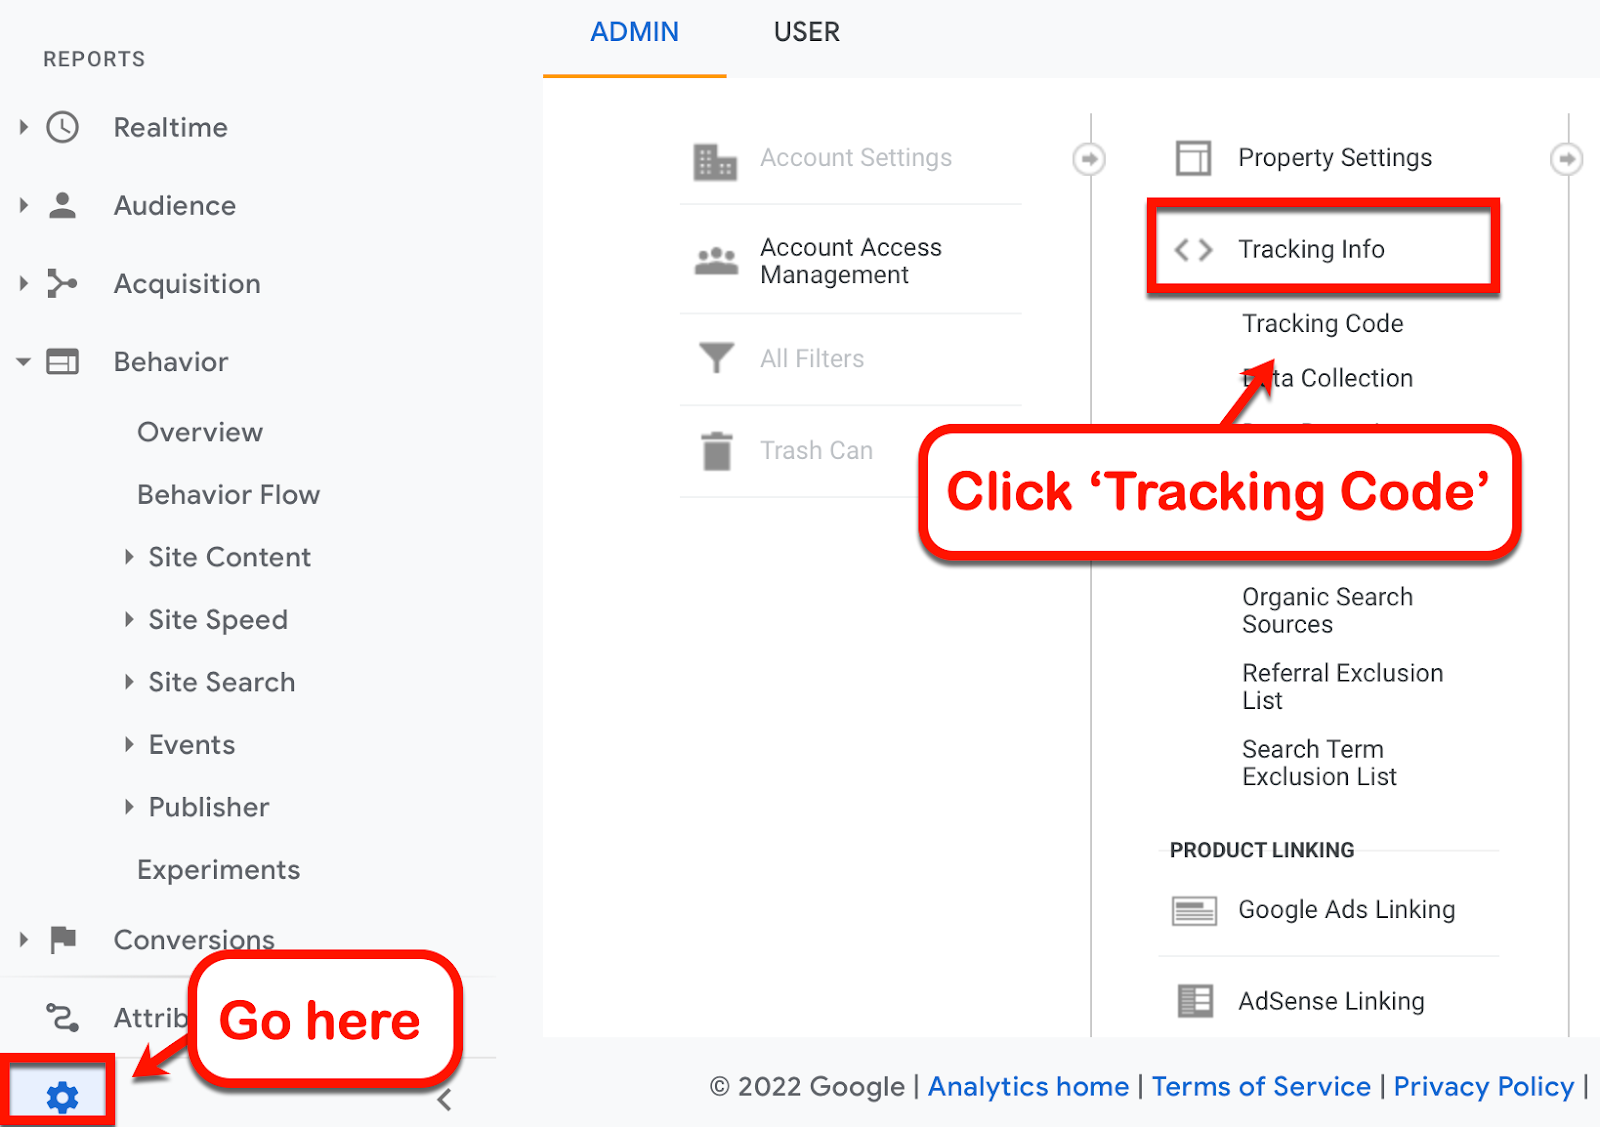
The code you're looking for is found under 'Tracking ID.' Copy this code and head back to your WordPress dashboard.
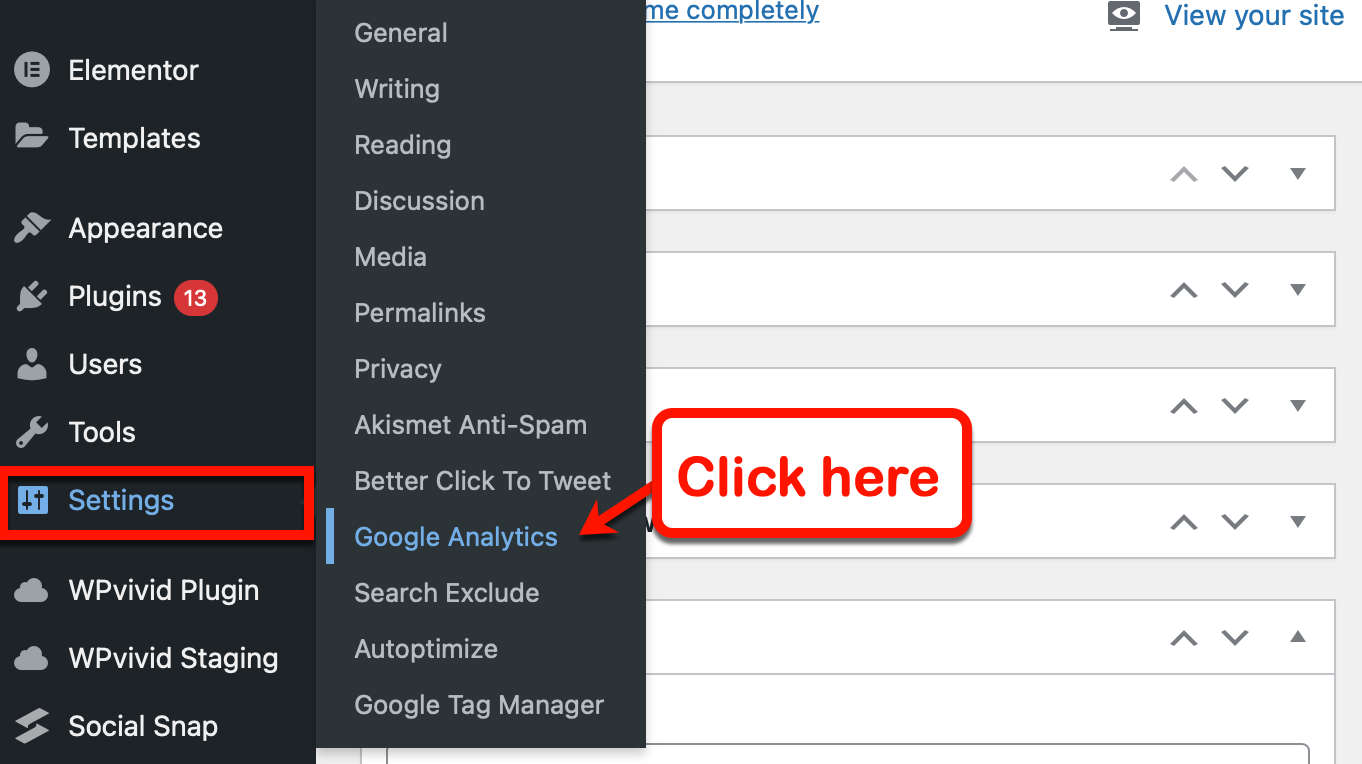
On your WordPress dashboard, expand the 'Settings' menu and select 'Google Analytics.'
If you can't find it, make sure you have installed and activated the GA Google Analytics plugin mentioned above.
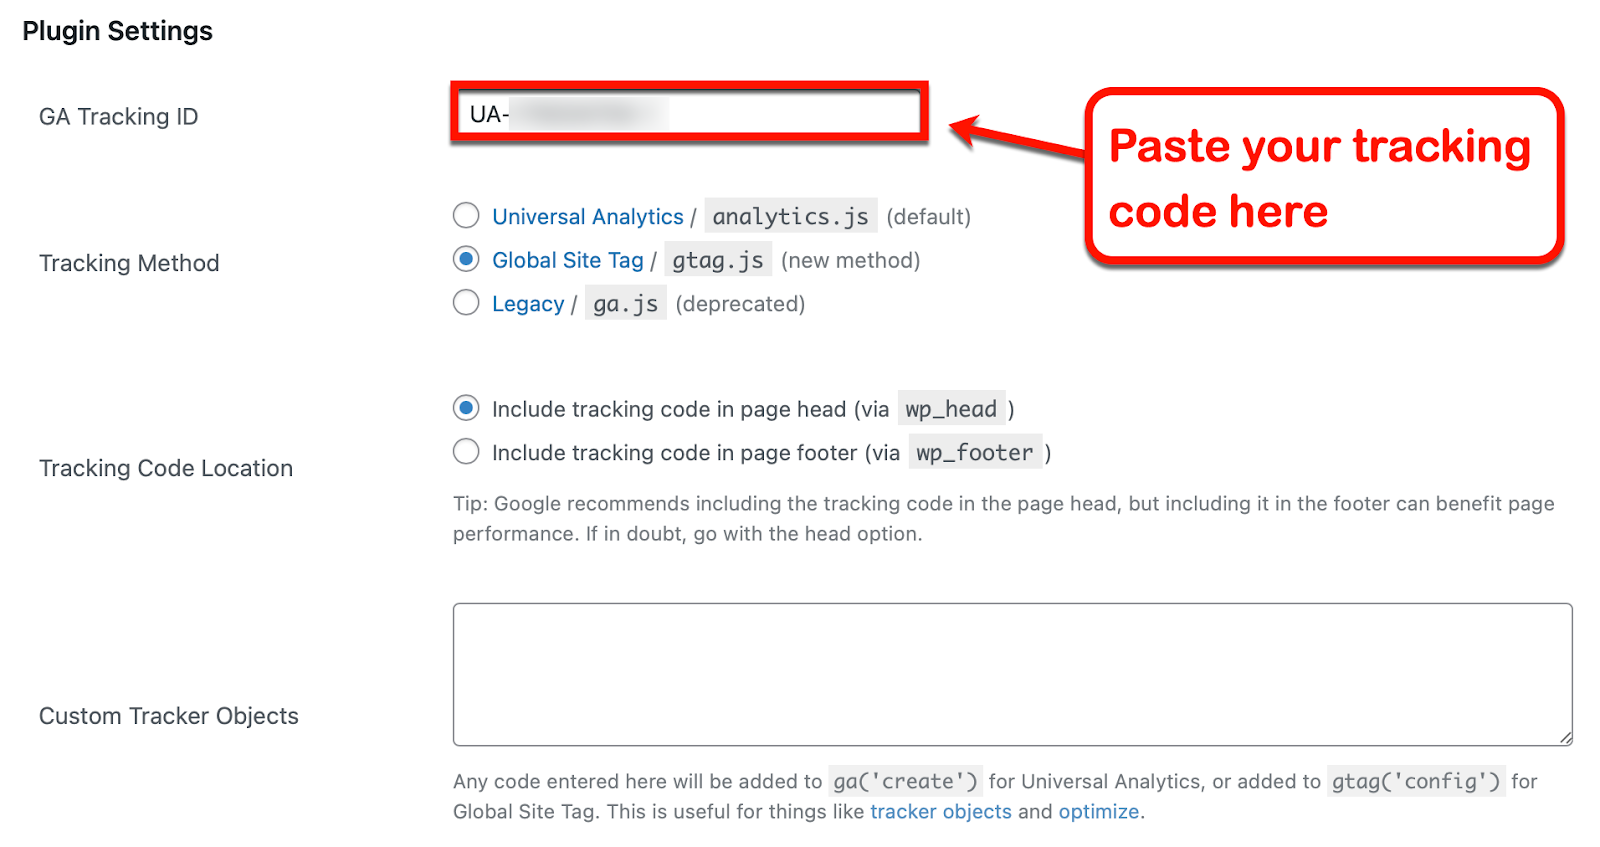
Once there, click the 'Plugin Settings' section and paste the code in the "GA Tracking ID" field.
Also, be sure to select 'Global Site Tag' as your tracking method. When done, click 'Save Changes' to finish linking your website to Google Analytics.
That's it — you're done with the setup.
Give Google Analytics 24-48 hours to collect enough data. You can tell when it's done by logging in to your account and checking the data on your home page.
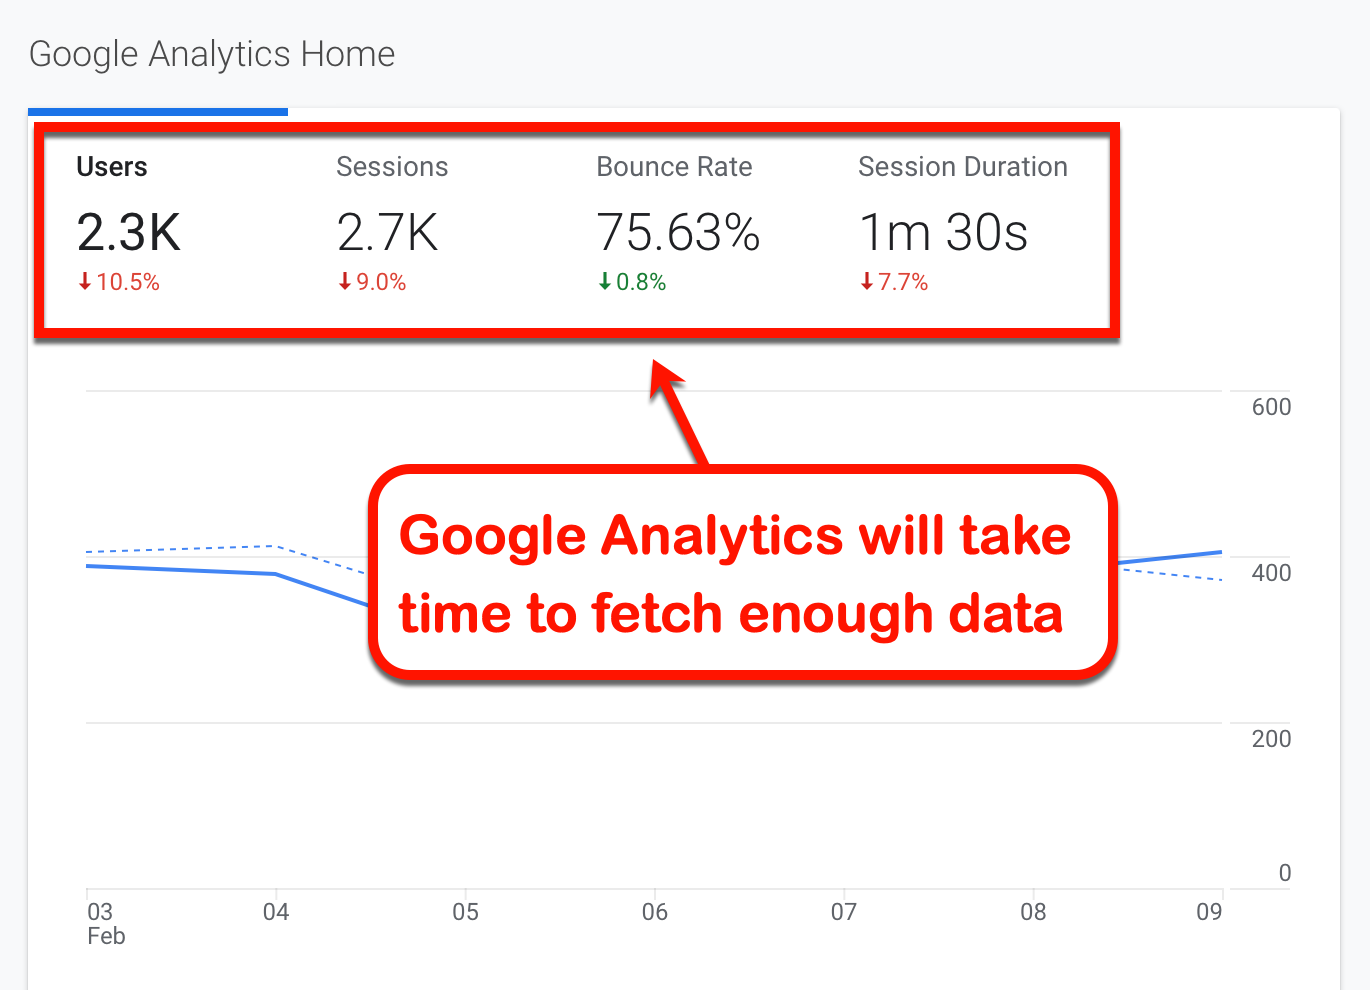
In the meantime, you can read the rest of this guide for tips on reading Google Analytics.
Let's jump right in.
1. Track your most popular pages
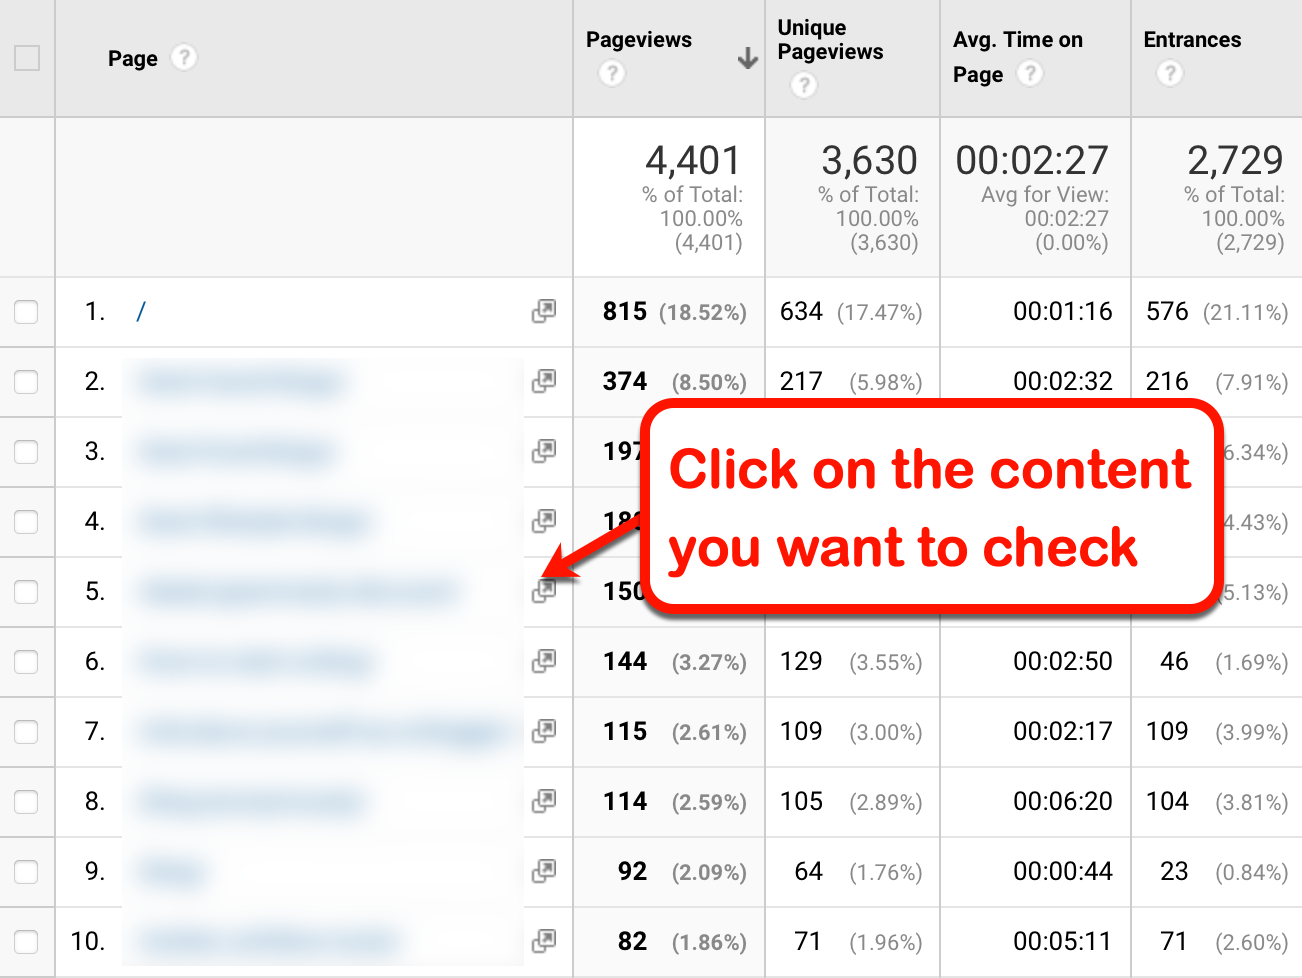
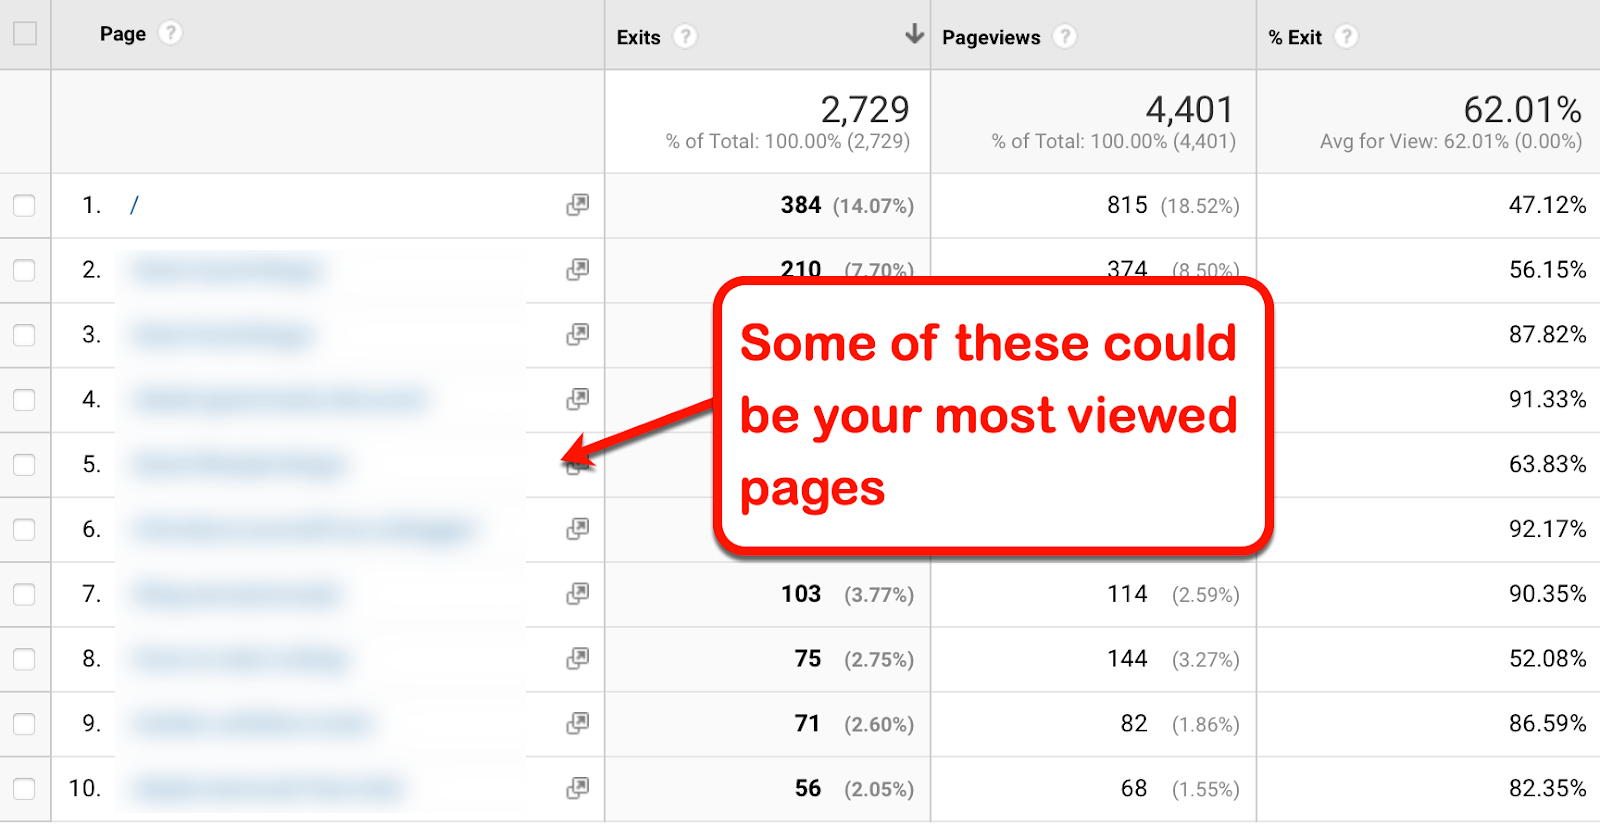
A great and simple way to use Google Analytics for content tracking is to find your most viewed pages.
To do this, go to the 'Behavior' sub-menu, select 'Site Content,' and click 'All Pages.'
By default, Google Analytics sorts your content according to pageviews. That means you can identify your most popular content right away.

Observing your most viewed content can tell a lot about your readers' preferred topics and content formats.
For example, if some of your top pages relate to the same topic, consider covering more sub-topics in the future. Certain content types may also stand out, like listicles, "how-to" guides, or product comparisons.
Just don't forget to consider the content promotion strategies you used in your most viewed pages.
After all, pageviews can sometimes be attributed to a successful, one-time promotion campaign — not necessarily the content quality.
You can verify this by checking your top pages' traffic sources.
To do this, click on the content you want to check.
From the 'Secondary dimension' drop-down menu, select 'Acquisition' and click 'Source.'
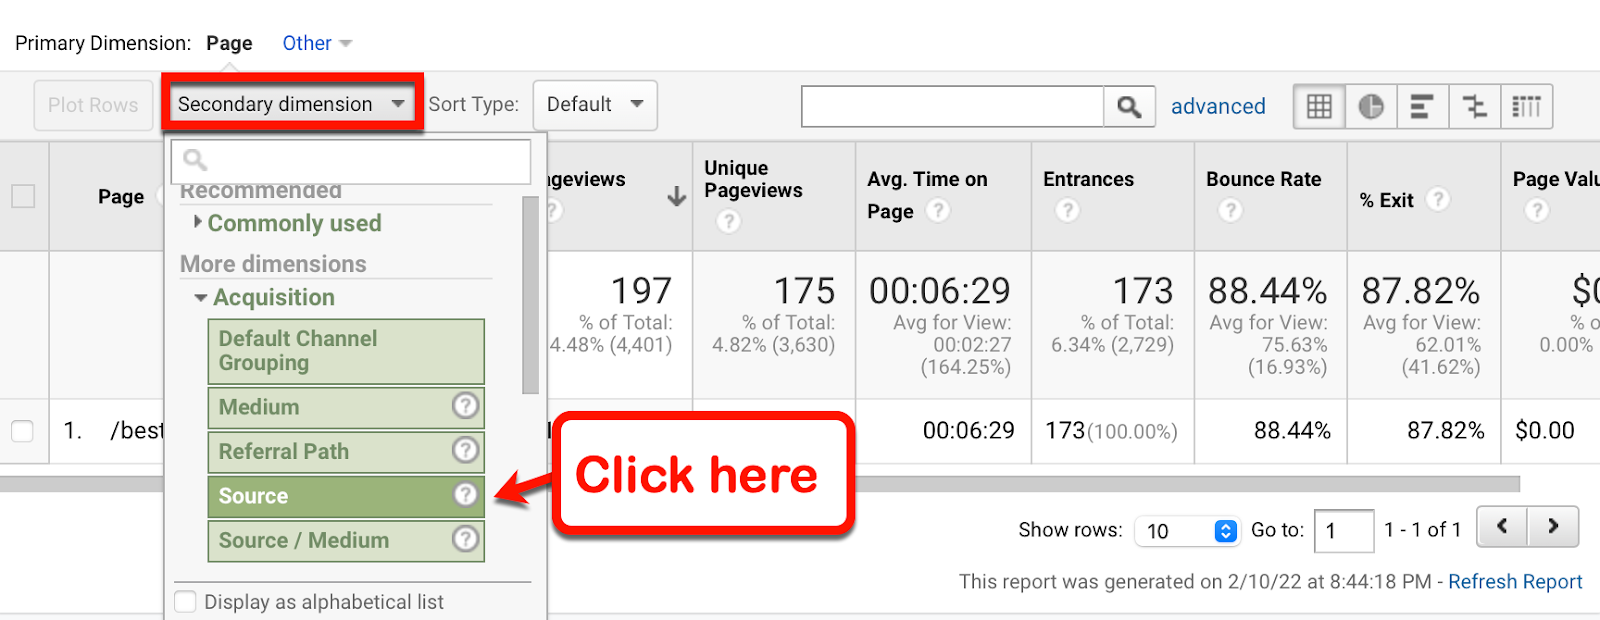
After a few seconds, Google Analytics will show you the top 10 traffic sources for the selected content.
If your page generated most of its traffic from organic sources, particularly search engines, you need to take down notes.
That page most likely earned traffic through effective SEO.
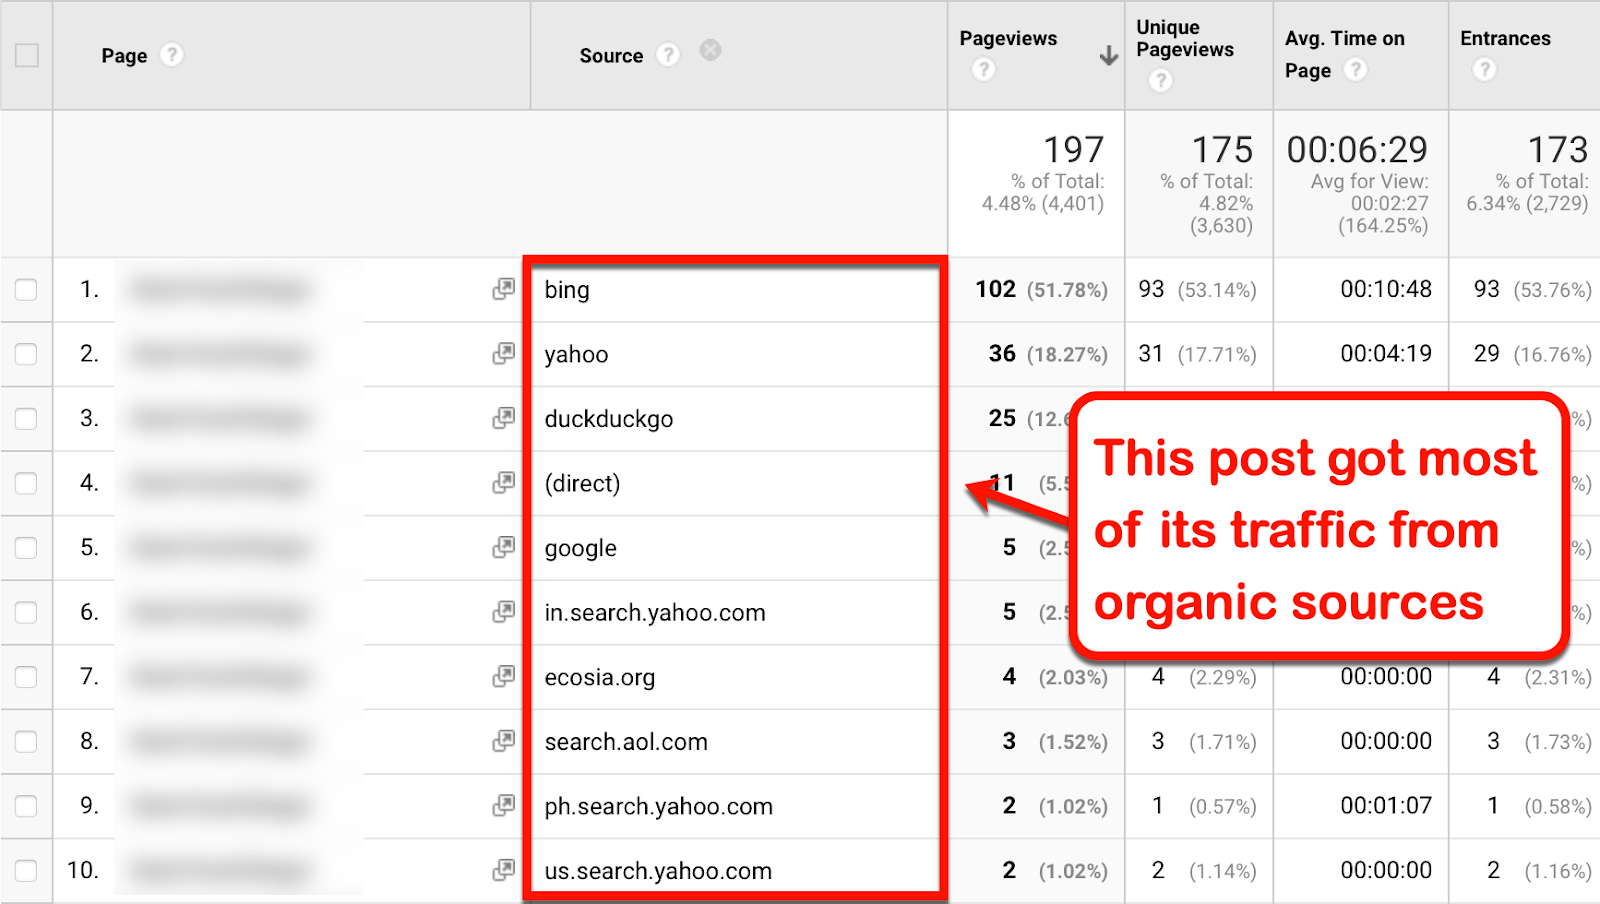
If you see pages with numbers like this, good job — you're really onto something.
But that doesn't conclude your content tracking journey.
Just because your content succeeds at getting organic traffic doesn't mean there's no need for improvements.
Next up, let's take a look at pages that put off readers.
2. Assessing problem pages
There are a couple of ways to find potentially problematic pages with Google Analytics.
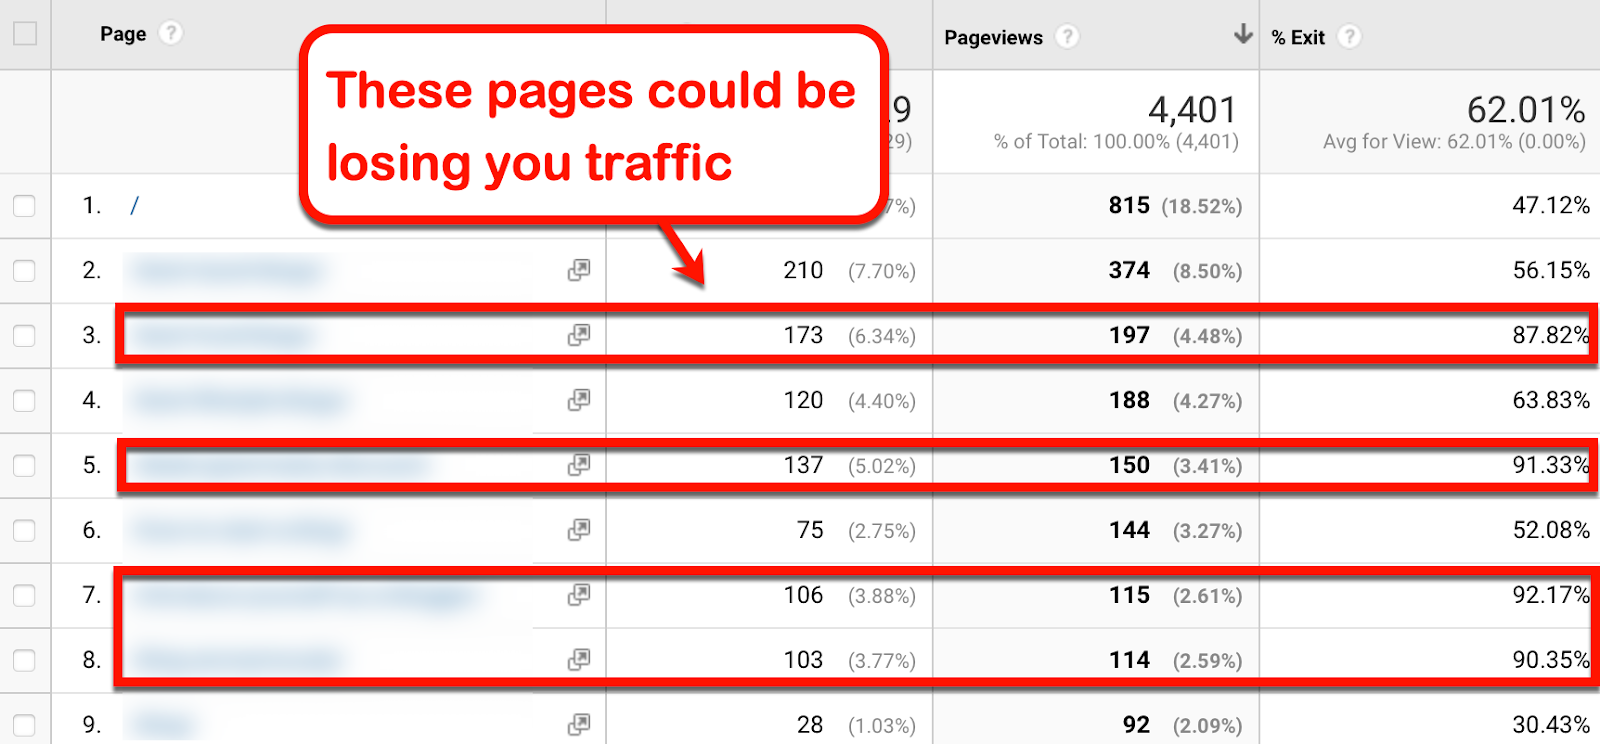
The easiest one is identifying your top exit pages — AKA pages where your readers tend to leave.
On your Google Analytics dashboard, go to 'Behavior,' select 'Site Content,' and click 'Exit Pages.'
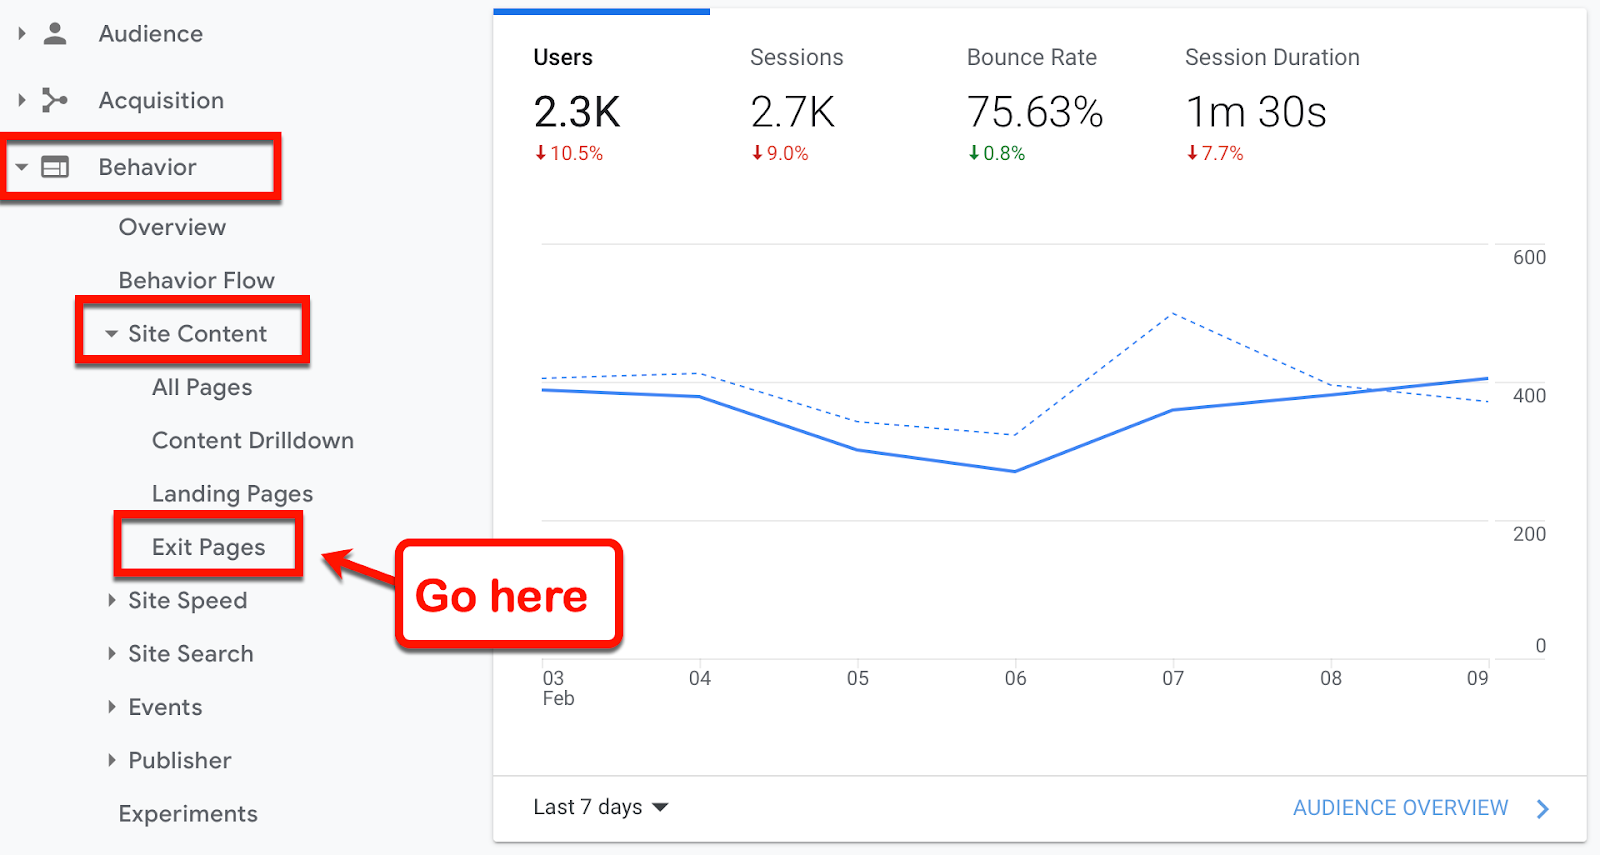
Google Analytics will almost immediately present you with a list of pages with the highest number of exits.
Don't be surprised to see some of your most viewed pages here. In most cases, a high number of visitors translates to a high number of exits.
That doesn't automatically mean that the content is bad.
For one, your top pages could simply be raking in loads of pageviews. Naturally, they'll have more readers leaving than most.
It's also possible that you're looking at a goal page, such as a "thank you" page. In which case, exits aren't bad because your audience has already made their purchase.
Goal pages aside, what you need to look at is the '% Exit' metric. This measures the percentage of users leaving a particular page.
A high %Exit value could indicate several things, like:
- Misleading content title tags: Your audience could be leaving your site because your content fails to meet their expectations. Be sure your posts fully address the questions and problems raised by their titles.
- Dead-end pages: Sometimes, readers exit simply because there's nowhere else for them to go. You can solve this issue by adding relevant internal links to the main content's body, sidebar, footer, and header.
- No call-to-action: You can also reduce your content's exit rate by blending in a compelling CTA. Try experimenting with creative ways to present your CTA, like exit-intent popups and contrasting CTA buttons.
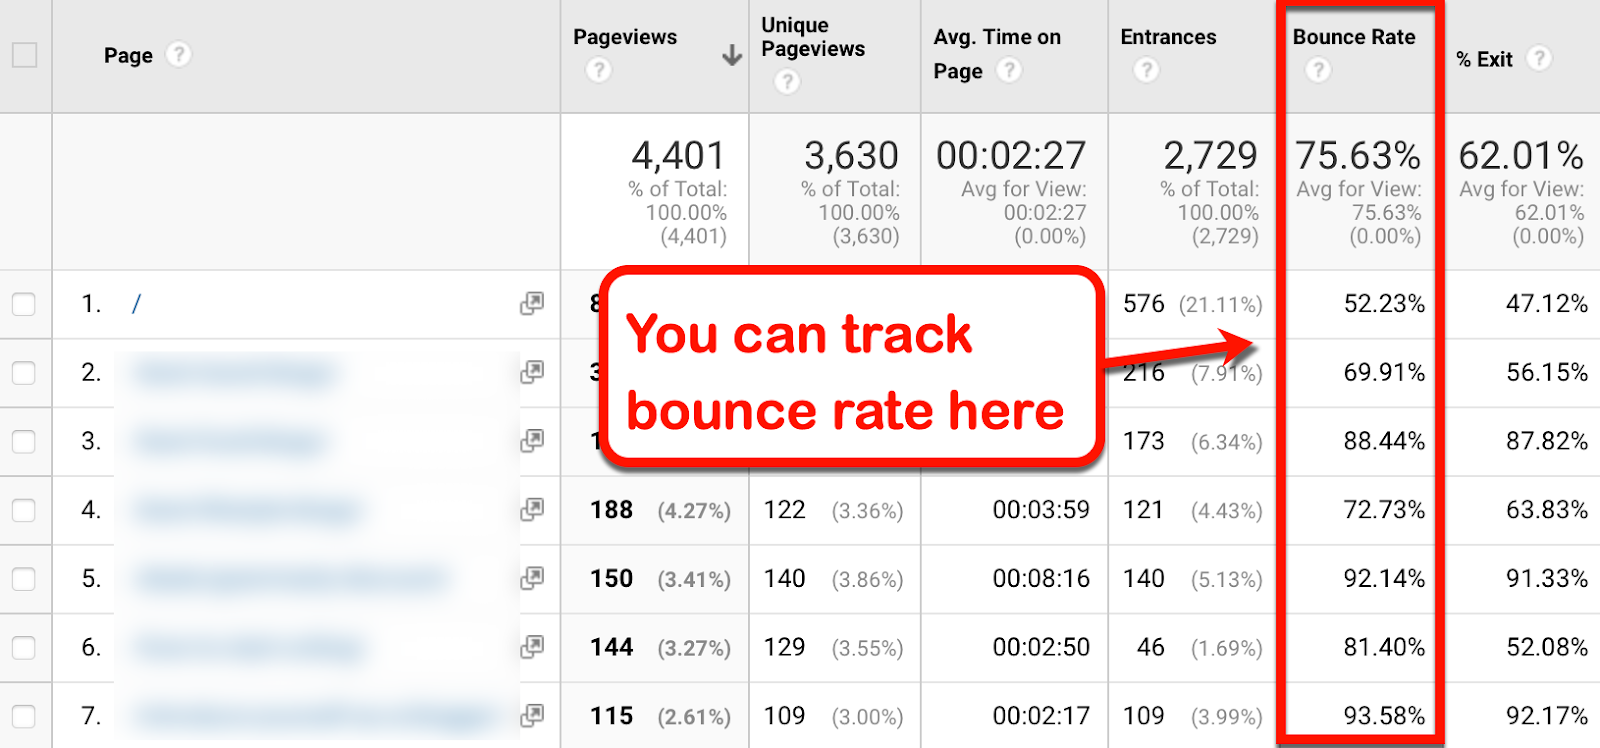
3. Fix pages with a high bounce rate
Aside from exit rate, you should also pay attention to content with a high bounce rate.
This metric measures the number of visitors leaving your site without interacting with anything.
Let's say a user finds your post on Google Search. But upon reading your post, they immediately lose interest — leaving your website on the spot.
In other words, they bounced right back to the search engine results.
You can easily find pages with a high bounce rate in your pages report on Google Analytics.
Similar to exit rate, bounce rate can be caused by dead-end content and unmet reader expectations. It can also be related to site-wide issues, like slow loading speed and errors.
If you find pages with an unusually high bounce rate, inspect the page firsthand using different browsers and devices.
4. Measure session duration
Okay — you already know several ways to find content that needs improvement using Google Analytics.
Let's go back to finding positive things about your current content arsenal.
Google Analytics can help you find pages that can keep readers hooked. You just need to focus on the metric: average time on page.
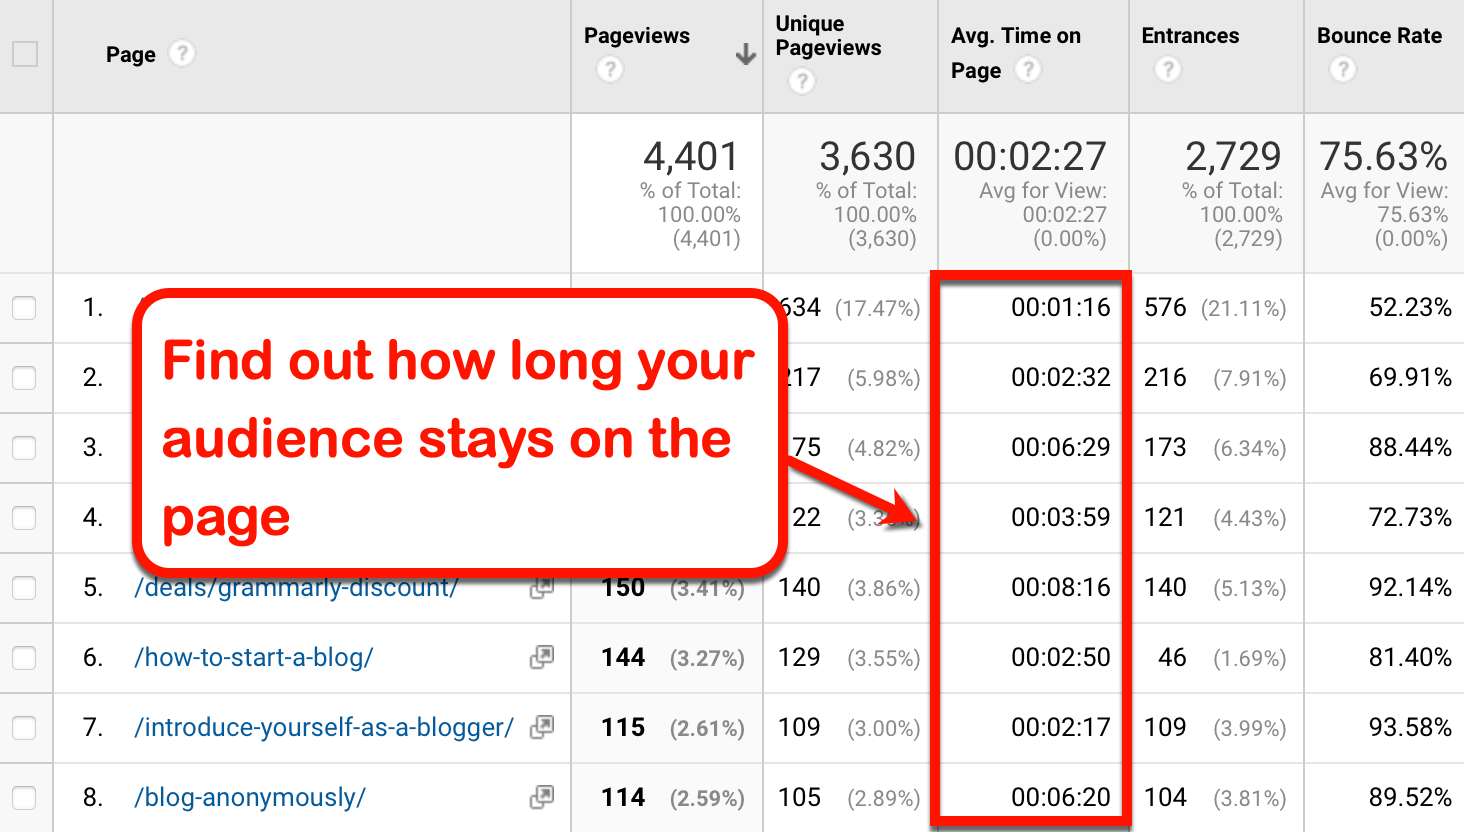
I recommend looking for pages that can keep your audience engaged longer than average.
For example, suppose the average time on page for your entire site is 2 minutes. Pages that can keep readers for 3 minutes or more could be worth inspecting.
Check for the following content elements when analysing these pages:
- Visual content
- Writing style and tone
- Content length
- Amount of actionable information
- Overall content structure
How to measure content marketing
Measure the success of your marketing through content tracking
Remember, spending time and money on content marketing optimisation is pointless if it doesn't eventually affect your bottom line. At the very least, content should contribute to your lead generation efforts by bringing traffic to key conversion pages. Sure, they'll take time to rank, but once the data starts coming in, you can hone your process and improve the effectiveness of your content.
Content tracking lets you monitor your content's effectiveness in achieving marketing goals.
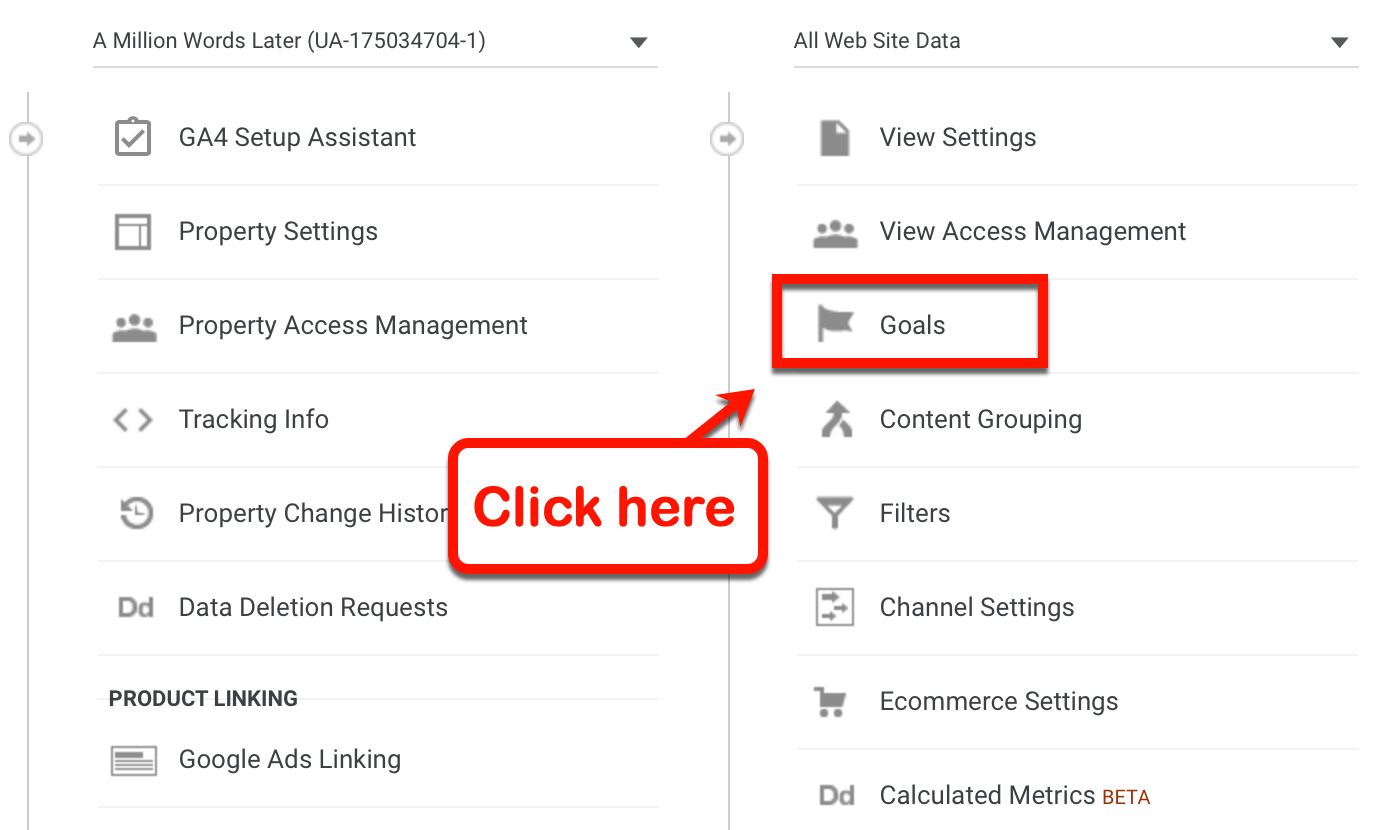
To track Google Analytics goals, head back to your admin settings page. Under "View," click 'Goals.'
Click 'New Goal' to build a goal tracker from the ground up.
Alternatively, you can import preset goals by clicking 'Import from Gallery.'
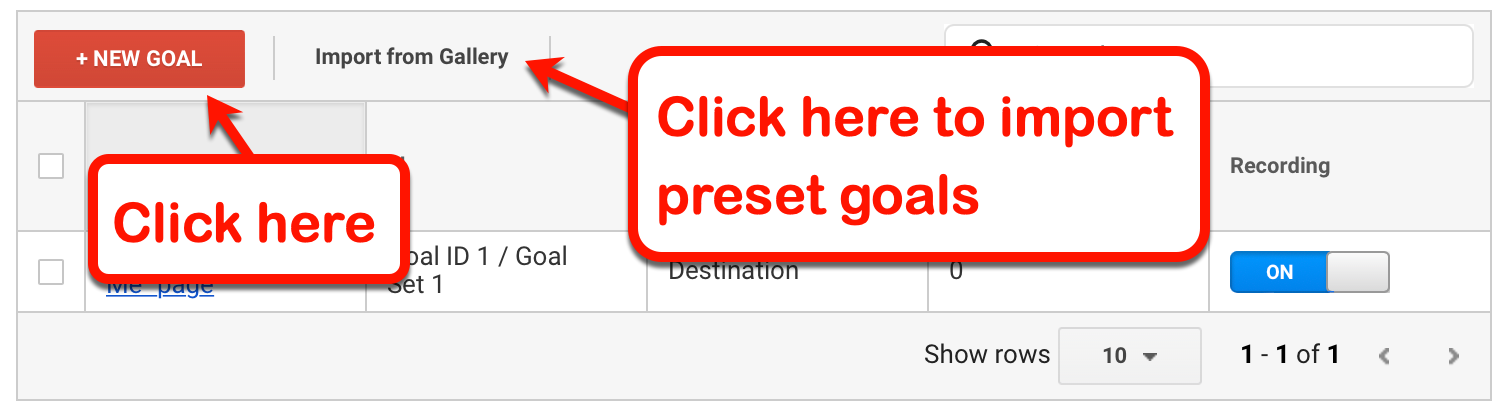
Preset goals often come in bundles to help beginners integrate advanced reports and segments into their Google Analytics account.
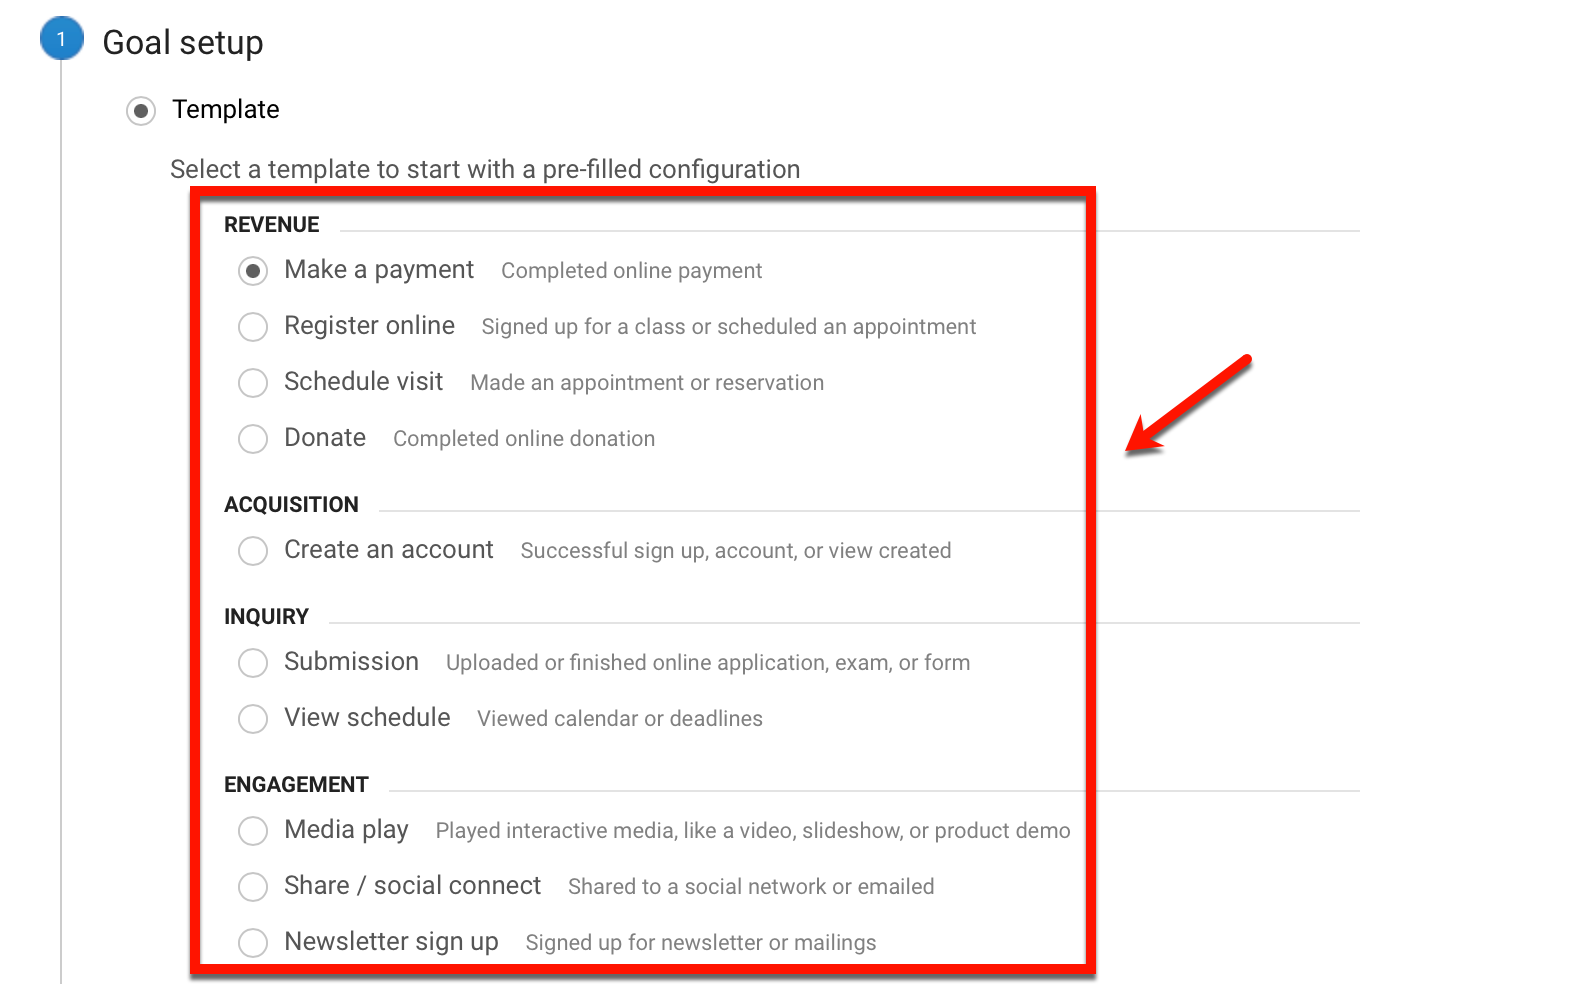
If you choose to create a goal from scratch, templates will save you a great deal of time.
You can find templates under "Goal setup" grouped in four categories: revenue, acquisition, inquiry, and engagement.
After choosing a goal template, the next step is to fill in your goal's description and details.
You can consider goals accomplished if users:
- Reach a specific page
- Stayed for a certain amount of time
- Visited a set number of pages
- Triggers a specific event
Now, how can you tell which pieces of content led to the completion of your goals?
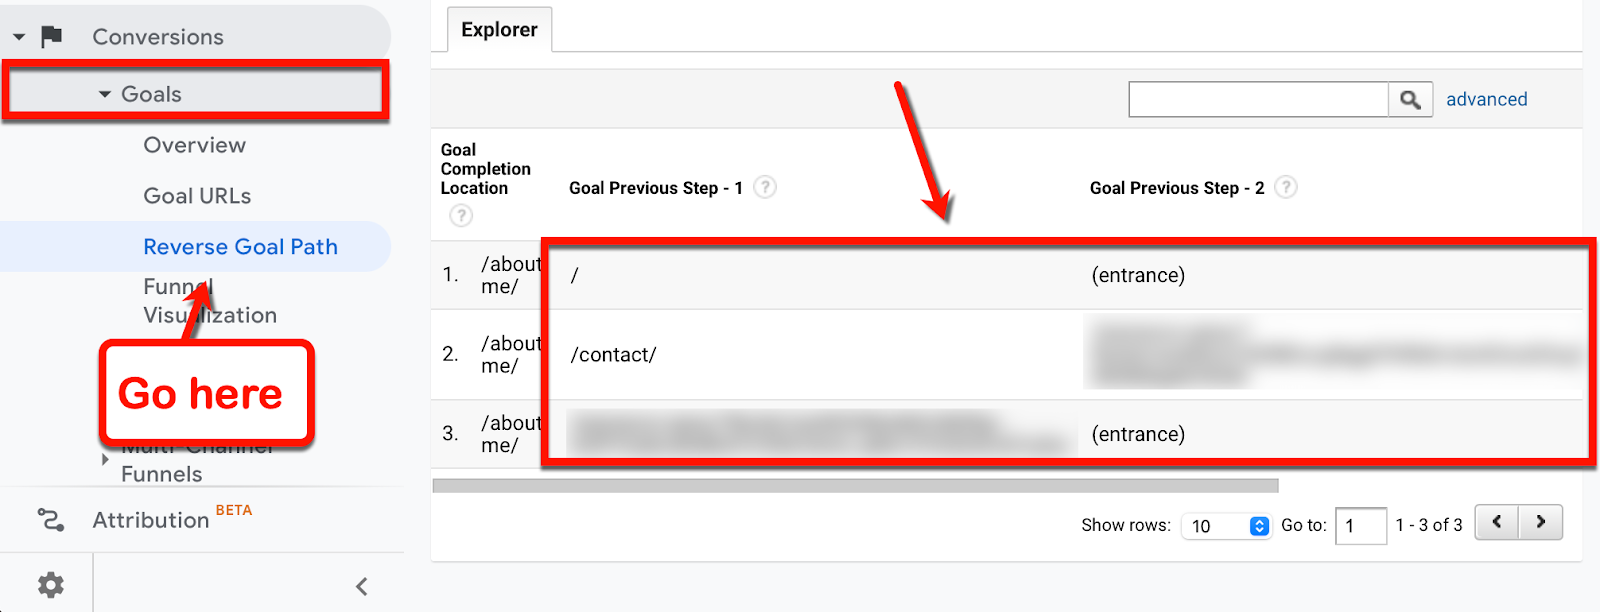
On Google Analytics, go to 'Conversions,' select 'Goals,' and click 'Reverse Goal Path.'
This will show you the list of pages users went through before reaching a goal.
Pretty cool, right?
That's how to measure success in marketing through content tracking.
Blog tracking do's and don'ts
To make the most out of your content tracker, let's review a few do's and don'ts.
Do: Check social media engagement
You can use social media management platforms to measure how content performs on networks like Facebook, Instagram, and LinkedIn.
Some examples are:
- Hootsuite
- Sprout Social
- SocialPilot
Don't: Measure interactions using your own IP address
Google Analytics lets you create IP filters to make sure your own sessions don't contribute to page views and other metrics. Check out OptinMonster's guide on how to do this.
Do: Track scroll depth
With Google Analytics and Google Tag Manager, you can create a custom event that tracks how far readers scroll.
Don't: Treat all visitors the same
Different visitors respond differently to content. Refer to the user demographics data on Google Analytics to create reader personas that can help with targeted content marketing.
Do: Fix broken links
You can search online for tools that can scan your website for broken links. They could be the reason why some users abandon your site dissatisfied.
Don't: Ignore page loading speed
Page loading speed is another factor that can affect your audience's content consumption experience. Google's PageSpeed Insights tool can help you boost your website's performance through actionable suggestions.
5 Reliable content tracking tips
Still not happy with your Google Analytics marketing strategy?
Before we wrap up this post, here are five dynamic tracking habits to help you feel more confident.
- Use heatmap tools to analyse audience behaviour visually
- Identify KPIs or Key Performance Indicators that matter to your brand
- Determine content seasonality (trends, current events, holidays, etc.)
- Split test multiple versions of your content using Google Optimize
- If you have the budget, invest in comprehensive solutions like SEMrush or Ahrefs
Content tracking FAQs
Below are some of the Frequently Asked Questions around content tracking:
How is content quality measured?
Content quality can be measured using performance metrics like unique visitors, click-through rate, scroll depth, and time on page. To paint a clearer picture, welcome your audience's feedback through surveys and public comment boxes.
How do I track content in Google Analytics?
You can track the performance of your content by connecting your website to your Google Analytics account. Google Analytics works by gauging metrics like bounce rate, traffic, session duration, and exit rate.
What KPIs do you use to measure content success?
For most brands, important KPIs include successful purchases, signups, social shares, downloads, and inbound links.
Start winning more business through content marketing optimisation
With the right guidance, content tracking can be done by anyone.
However, it's easier to turn a torrent of data into actionable chunks of information with experienced hands.
Don't hesitate to send me a message if you need help setting up your content tracking system. I'm more than happy to answer your questions and help you reap the full benefits of data-driven content marketing.